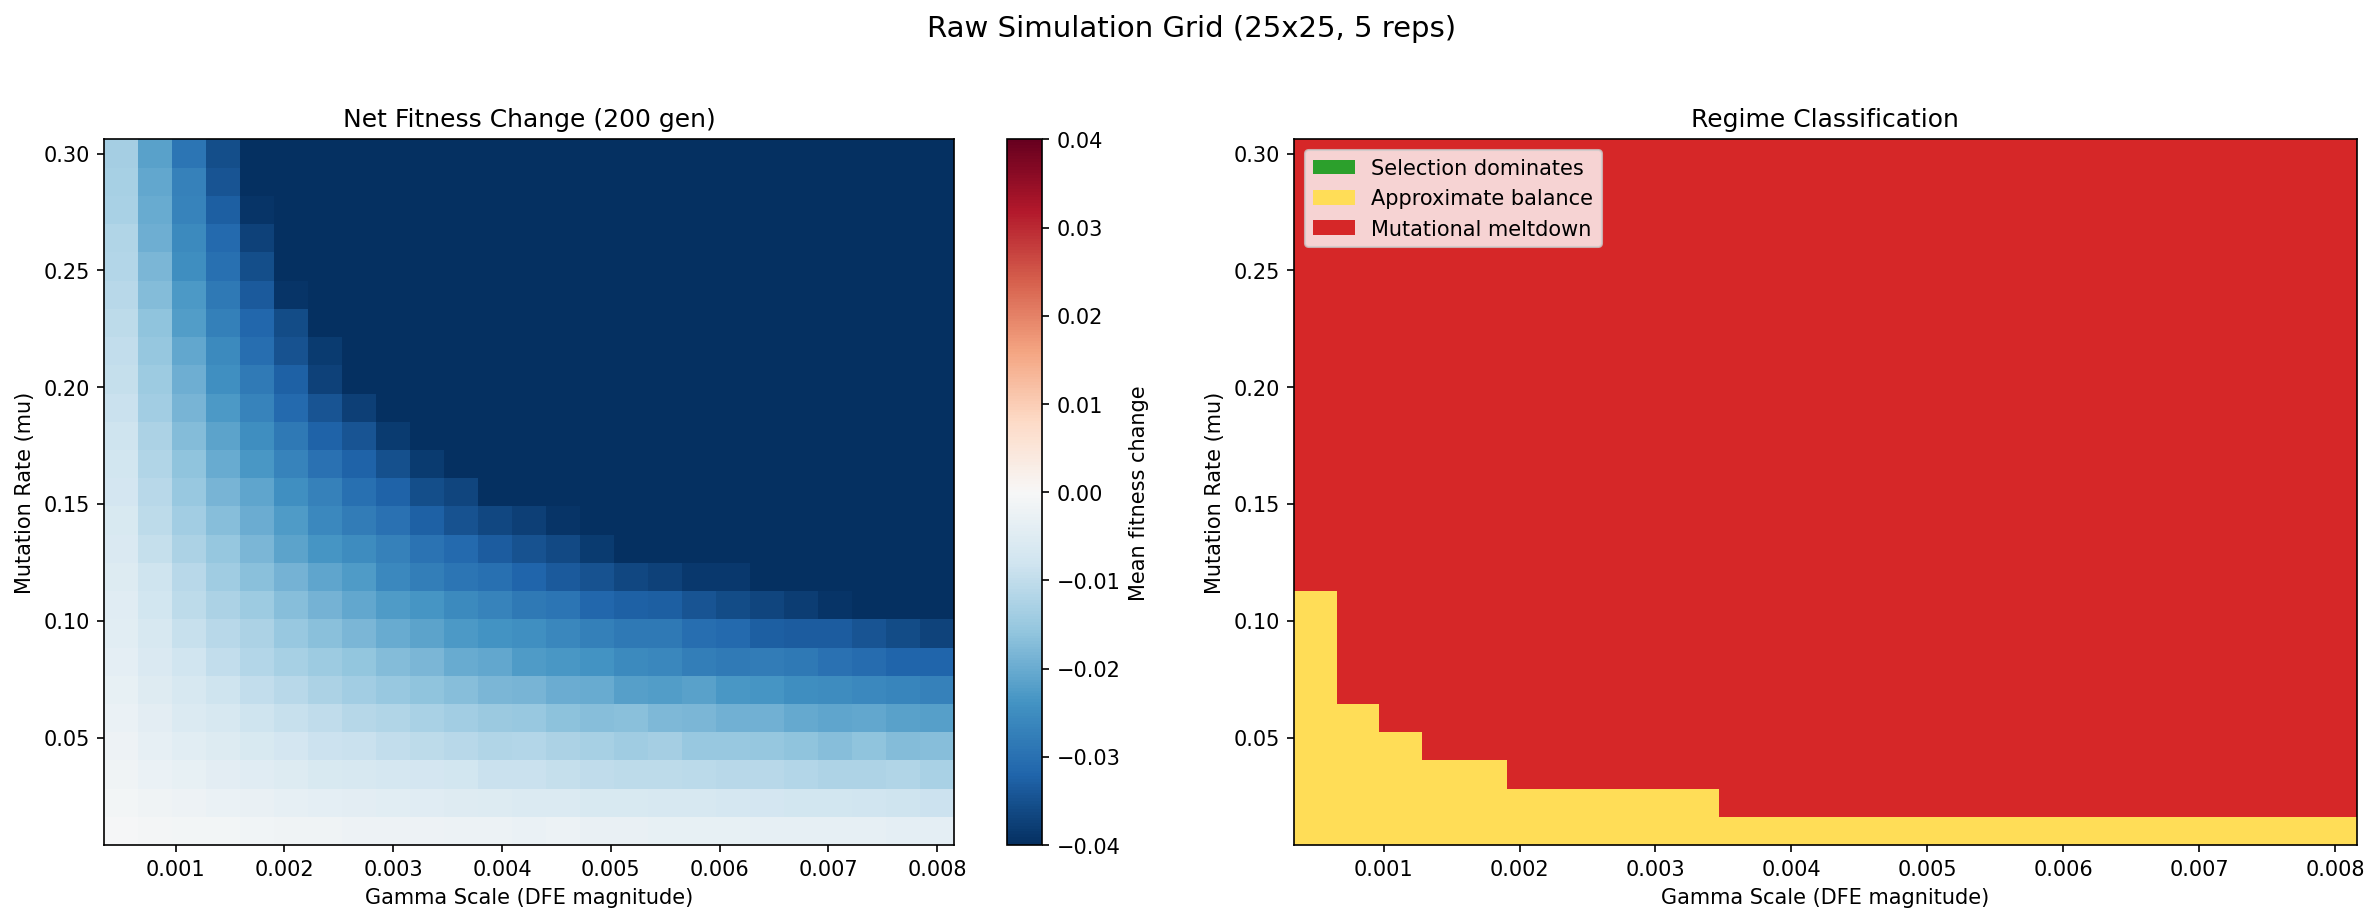
Figure 1: Direct simulation scan over mutation rate (mu) vs. DFE scale (gamma_scale) — a 2D slice through the Basener-Sanford critical condition.
A 25 x 25 grid with 5 stochastic replicates per point (3,125 simulations total). Each simulation runs the full stochastic mutation-selection model for 200 generations, starting from identical initial conditions, and measures the net change in mean population fitness.
Left panel — Net fitness change: Blue regions indicate parameter combinations where the selective variance Var(m) exceeds the mutational drag mu * |E_g[s]| * b-bar, so mean fitness increases over 200 generations. Red regions indicate the opposite: mutational drag dominates, and fitness declines. The black contour at zero is the empirical phase boundary — the error threshold. Points on this contour represent the exact parameter combinations where the two forces in the Basener-Sanford theorem are balanced.
Right panel — Discrete regime classification: Each grid point is classified into one of three regimes corresponding to the phases described by Lynch and Gabriel (1990). Green = selection dominates (fitness increasing, the population adapts successfully). Yellow = approximate balance (the two forces nearly cancel, producing slow or ambiguous fitness change). Red = mutational meltdown (fitness declining, deleterious mutations accumulating irreversibly via Muller's ratchet).
Key observation: The transition from green to red is sharp — there is very little yellow "balance" zone. This indicates a genuine phase transition, not a gradual shift. Populations do not slowly slide from adaptation to decline; instead, there is a well-defined threshold above which the system tips decisively into meltdown. This sharpness validates the theorem's prediction that the sign of the combined mutational term determines the qualitative evolutionary outcome.